Engaging Youth in the Provincial Voting Process
Identifying opportunities for service improvements to the Elections Ontario app.
My Role
Service Designer
Team
5 Service Designers
Timeline
5 days
Tools
Figma, Miro


Let’s get your onboarded!
Start
Maybe later


We can help you with it!
Check if you’re registered to vote

Confirm, update or add your information to get a scannable version of your voter information card!
Check
You can skip and complete it at a later time.
Back
Finish

Announcements
There is a road block in front of the entrance. Please use another way.
View 2 More

1234 Birch Street,
Toronto, ON
M4B 1B3
get directions
Here is your Check list:
Based on your chocies
Make sure you have your ID
Make sure you have your VIC
Home
Voting Day
Profile

Home
Voting Day
Profile

District #0514:
499 Have Voted · 47% Prepared
Live Elector Participation by District
Project overview
Design challenge
Since the Elections Ontario (EO) mobile app launched in 2022, it has seen little evolution and declined user engagement, especially among youth. How might the EO app incentivize youth participation in the democratic experience, while supporting field staff?
Approach
To understand opportunities for service improvement, our team mapped the user journey, service touchpoints, and supporting infrastructure in a service blueprint, and conducted user research to identify what an ideal voting experience could look like for both electors and polling staff.
View the prototype
Design process
Service mapping
Background research, service blueprints
User research
Rapid user research and synthesis
Design sprints
Idea generation and storyboarding
The solution
Mid and hi-fidelity mockups, pitch presentation
Service mapping
Service blueprint
Before identifying service improvement opportunities to the EO app, we needed to adequately familiarize ourselves with the service landscape. Following the six service stages as outlined in the client brief, our team mapped user and provider touchpoints with the service, as well as supporting infrastructure involved in each stage. We utilized the client brief, the client presentation/Q&A, and secondary research to populate the blueprint.

Service outcomes
Supplementing the service blueprint is our mapping of service outcomes. Service outcomes detail what it would look like for the service to perform well at each stage. This includes meeting core user needs at each stage, as well as each stage being run as efficiently as possible on the provider side.

User research
Rapid user research
The goal of user research was to identify obstacles to efficiency, security, and accessibility in the voting process. I led the research planning and facilitation, which involved asking users to organize images of touchpoints they'd interact with in the voting process and asking follow-up questions based on their positioning of the touchpoints.

Synthesis
Our user research participants provided insight into what points of the user journey they wish could go differently, which we pinpointed on our existing service map as pictured below. Specifically, users indicated a need for:
Increased motivation to use the app beyond it simply listing "requirements"
Reduced wait times in polling stations
An aspect of fun attached to voting
Greater app visibility prior to or at the beginning of election season, as 0 participants were aware of the app prior to our user research

Design sprints
Idea generation
We took pen to paper to illustrate how solution ideas would manifest in the user journey. Each lo-fi storyboard only focused on one idea at a time, which we later realized was limiting our ideation process.

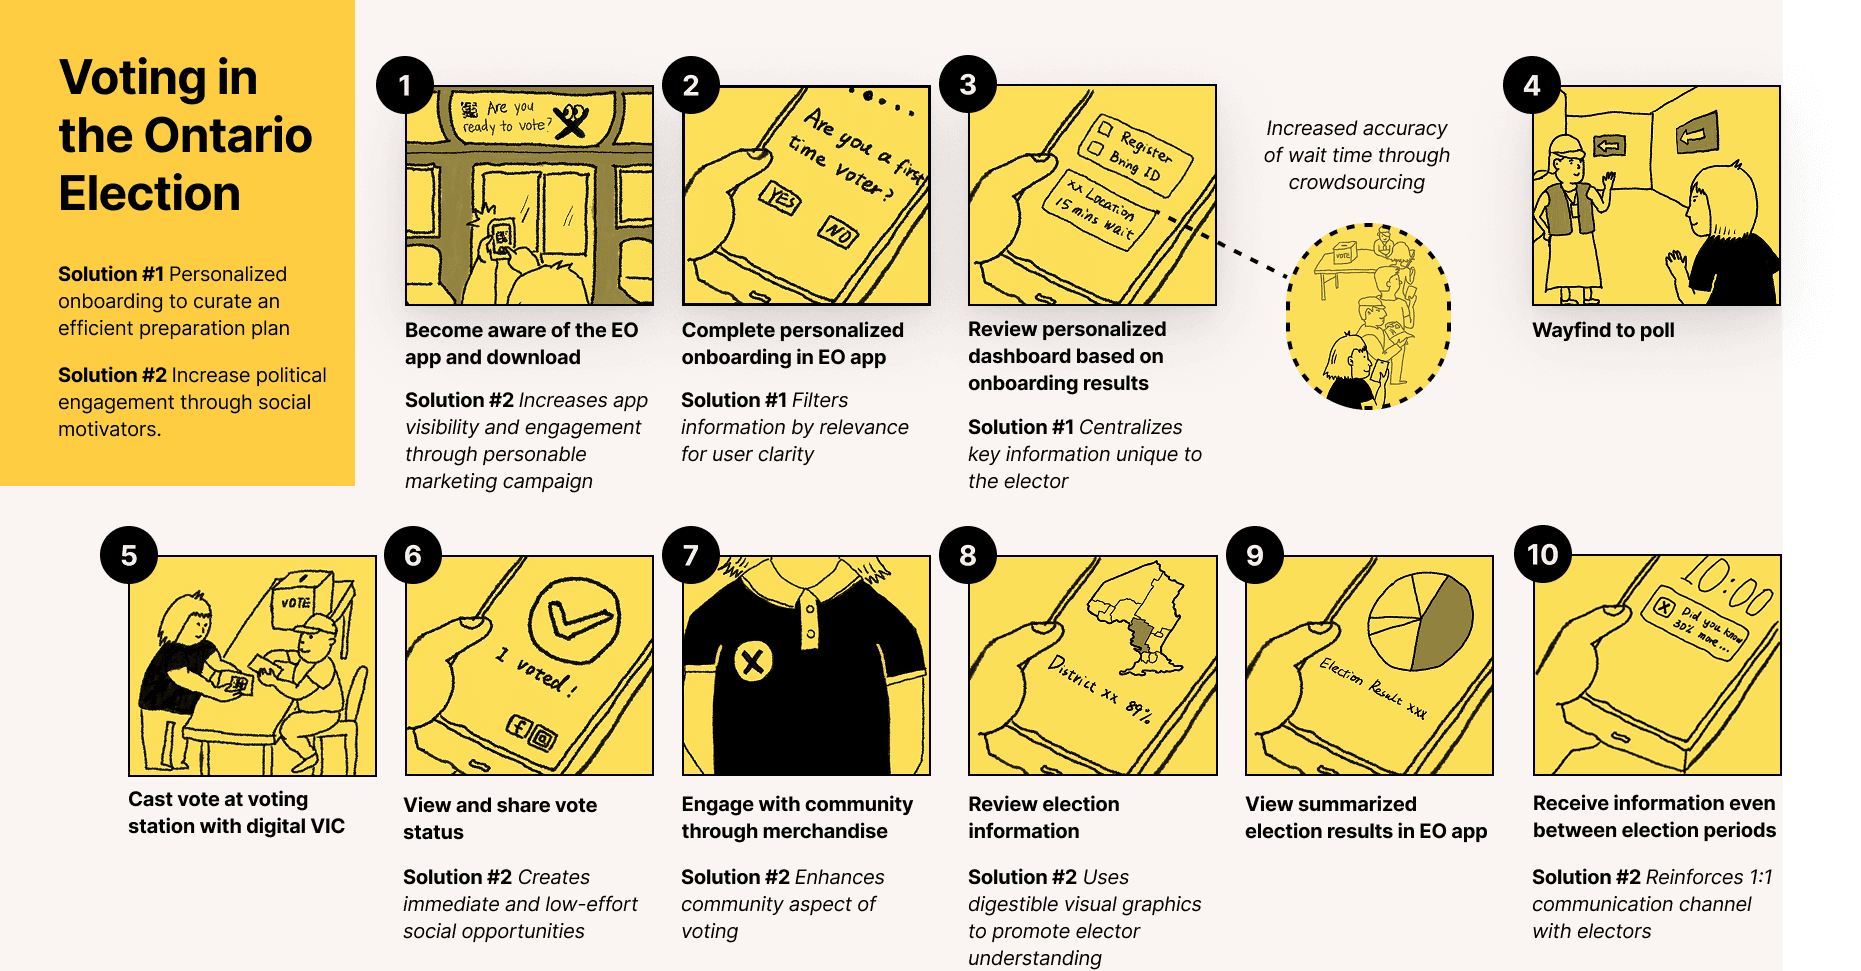
Storyboarding
We chose to combine a few earlier storyboards into a more comprehensive solution, pictured below.
The solution
Personalized onboarding
I deigned and prototyped the lo-fi and hi-fi personalized onboarding flow in Figma. This solution specifically targeted user needs for efficiency while alleviating the workload of EO polling and field support staff on election day by better ensuring elector preparedness.
Lo-fi flow:

Hi-fi flow:

Crowdsourced wait times
I designed a crowdsourced wait time feature to address the user research finding that electors want to learn of poll station wait times before leaving to vote. This feature provides the dual benefit of engaging electors while relieving polling station staff of this duty, and ultimately reduces traffic to polling stations.
Lo-fi vs. Hi-fi:

My takeaways
Balancing competing needs
Our best ideas involved benefitting users and the service provider as equally as possible. Realizing this taught me how crucial a role service design plays in transforming organizations for the better.
Designing in political environments
Working with Elections Ontario as a client also provided unique insight into how to design for political neutrality and credibility. Upon presenting our solutions to the Elections Ontario team, we discussed the appropriateness of social media features for a public agency that does not want to alienate older voters. This allowed us to further refine our sensitivity to competing user needs, and taught us to position such innovative features as lightly integrated and grounded in evidence on social influence.
Section heading suggests this information will be contained in this section, not on a separate page.